The following diagram is a cost-volume-profit graph for a manufacturing company: 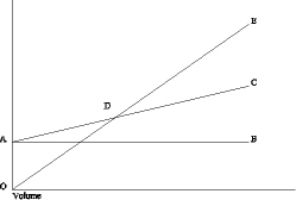
- Select the answer that best describes the labeled item on the diagram.
A) Area CDE represents the area of net loss.
B) Line AC graphs total fixed costs.
C) Point D represents the point at which the contribution margin per unit increases.
D) Line AC graphs total costs.
Correct Answer:
Verified
Q22: Sales mix refers to
A) the different volume
Q28: Which of the following assumptions does NOT
Q36: A profit-volume graph
A)measures profit or loss on
Q37: Which of the following statements is TRUE?
A)The
Q40: Assuming all other things are the same,
Q50: Patricia Company produces two products,X and Y,which
Q54: The following data pertain to the three
Q58: The total revenue line rises with a
Q60: Malone Printing Company projected the following information
Q64: The Allen Company had the following income
Unlock this Answer For Free Now!
View this answer and more for free by performing one of the following actions

Scan the QR code to install the App and get 2 free unlocks

Unlock quizzes for free by uploading documents