The following diagram is a cost-volume-profit graph for a manufacturing company: 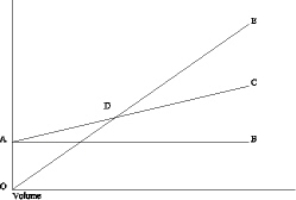
-The difference between line AB and line AC (area BAC) is the
A) contribution ratio.
B) total variable cost.
C) contribution margin per unit.
D) total fixed cost.
Correct Answer:
Verified
Q18: Product 1 has a contribution margin of
Q24: In a cost-volume-profit graph,
A) the total revenue
Q27: In a cost-volume-profit graph, the slope of
Q37: Which of the following statements is TRUE?
A)The
Q47: Information about the Harmon Company's two products
Q52: Information about the Harmon Company's two products
Q53: Assume the following cost behavior data for
Q54: The following data pertain to the three
Q62: In the cost-volume-profit analysis, income taxes
A)are treated
Q68: Which of the following is a TRUE
Unlock this Answer For Free Now!
View this answer and more for free by performing one of the following actions

Scan the QR code to install the App and get 2 free unlocks

Unlock quizzes for free by uploading documents