The following diagram is a cost-volume-profit graph for a manufacturing company: 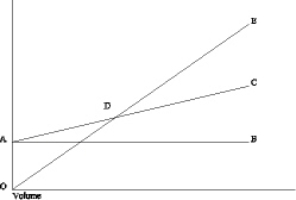
-The formula to determine the Y-axis value ($) at point D on the graph is
A) Fixed costs + (Variable costs per unit ´ Number of units) .
B) SXY - bSX.
C) Fixed costs/Unit contribution margin.
D) Fixed costs/Contribution margin ratio.
Correct Answer:
Verified
Q12: On a profit-volume graph, the profit line
Q18: Product 1 has a contribution margin of
Q24: In a cost-volume-profit graph,
A) the total revenue
Q38: Sarah Smith, a sole proprietor, has the
Q39: The Allen Company had the following income
Q40: Sarah Smith, a sole proprietor, has the
Q42: Assume the following cost behavior data for
Q47: Information about the Harmon Company's two products
Q62: In the cost-volume-profit analysis, income taxes
A)are treated
Q71: In multiple-product analysis, direct fixed costs are
A)fixed
Unlock this Answer For Free Now!
View this answer and more for free by performing one of the following actions

Scan the QR code to install the App and get 2 free unlocks

Unlock quizzes for free by uploading documents