The diagram below is a: 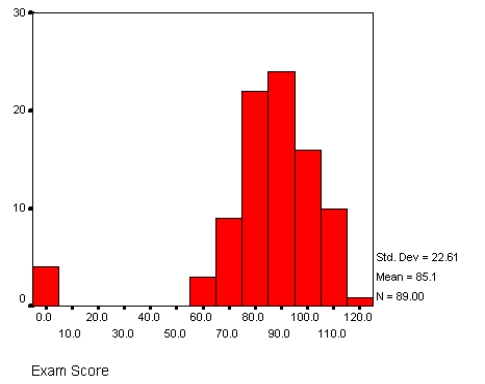
A) Mean
B) Mode
C) Bar chart
D) Frequency polygon
E) Histogram
Correct Answer:
Verified
Q31: The process of checking data carefully for
Q32: Which summary statistic should be used for
Q33: When researchers analyze data that they did
Q34: The total number of cases in a
Q35: What measure of variability is most appropriate
Q37: The diagram below is a: 
Q38: The diagram below is a
Q39: Which of the following data displays would
Q40: Which of the following data displays represent
Q41: A type of descriptive statistic that summarizes
Unlock this Answer For Free Now!
View this answer and more for free by performing one of the following actions

Scan the QR code to install the App and get 2 free unlocks

Unlock quizzes for free by uploading documents