Data extracted from the accounting information system of TXC Corporation produced the following graph. The equation of the dashed line is y = $25x; the equation of the solid line is y = $200 + $5x. Which of the following terms best describes the graph?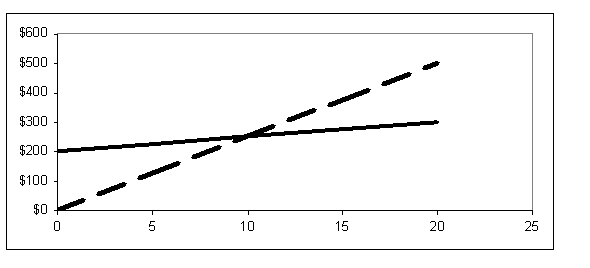
A) Learning curve graph
B) Operating leverage graph
C) Margin of safety graph
D) Cost-volume-profit graph
Correct Answer:
Verified
Q73: Data extracted from the accounting information system
Q74: Data extracted from the accounting information system
Q75: Data extracted from the accounting information system
Q76: Data extracted from the accounting information system
Q77: Ruben, Inc. is a management consulting firm
Q77: Steiner Manufacturer's contribution margin is $200, after-tax
Q78: The Nunn Co. produces a single product.
Q80: Grady, Inc. produces a single product and
Q82: SXF sells its single product for $14
Q93: Stuart, Inc. produces one item which sells
Unlock this Answer For Free Now!
View this answer and more for free by performing one of the following actions

Scan the QR code to install the App and get 2 free unlocks

Unlock quizzes for free by uploading documents