Use the following to answer questions:
Figure: Shifts in Demand and Supply III 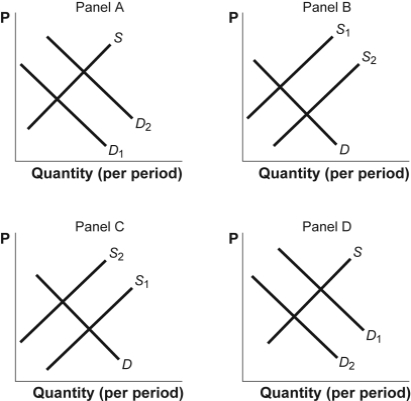
-(Figure: Shifts in Demand and Supply III) Use Figure: Shifts in Demand and Supply III.The figure shows how supply and demand might shift in response to specific events.Suppose a wet and sunny year increases the nation's corn crop by 20%.Which panel BEST describes how this will affect the market for corn?
A) Panel (a)
B) Panel (b)
C) Panel (c)
D) Panel (d)
Correct Answer:
Verified
Q116: Use the following to answer questions:
Figure: Four
Q117: Use the following to answer question:
Q117: Use the following to answer question 102:
Q118: The market equilibrium is found at the:
A)
Q119: Use the following to answer question:
Q122: Use the following to answer questions:
Figure: Shifts
Q123: Use the following to answer questions:
Figure: Shifts
Q124: Use the following to answer questions:
Figure: Shifts
Q125: Use the following to answer questions:
Figure: Shifts
Q126: Use the following to answer questions:
Figure: Shifts
Unlock this Answer For Free Now!
View this answer and more for free by performing one of the following actions

Scan the QR code to install the App and get 2 free unlocks

Unlock quizzes for free by uploading documents