Use the following to answer questions: 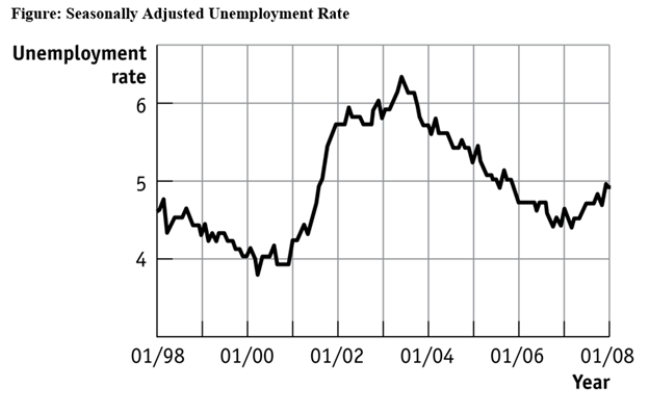
-(Figure: Seasonally Adjusted Unemployment Rate) Use Figure: Seasonally Adjusted Unemployment Rate.The distance between each labeled point on the horizontal axis is 1 year,and the distance between each labeled point on the vertical axis is 1 percentage point of unemployment.Unemployment was _____ between 1/2001 and 1/2002 and _____ between 1/1999 and 1/2000.
A) increasing;decreasing
B) increasing;increasing
C) decreasing;increasing
D) decreasing;decreasing
Correct Answer:
Verified
Q21: Use the following to answer questions:
Q21: Use the following to answer question:
Q23: Use the following to answer questions:
Q24: Use the following to answer question:
Q25: Use the following to answer questions:
Q27: Use the following to answer question 43:
Q28: Use the following to answer question 22:
Q33: Use the following to answer question:
Q36: The ratio of the change in the
Q40: Use the following to answer question:
Unlock this Answer For Free Now!
View this answer and more for free by performing one of the following actions

Scan the QR code to install the App and get 2 free unlocks

Unlock quizzes for free by uploading documents