Use the following to answer questions:
Figure: Indifference Curve Map I 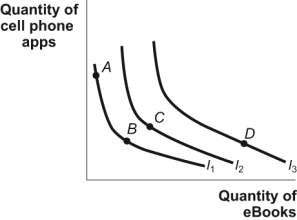
-(Figure: Indifference Curve Map I) Look at the figure Indifference Curve Map I. It shows that:
A) at point A utility is higher than it is at point B.
B) utility is diminishing on I1, constant on I2, and increasing on I3.
C) utility is higher at point D than at point A.
D) the marginal utility of e-books is positive, while the marginal utility of cell phone apps is negative.
Correct Answer:
Verified
Q2: A curve that represents combinations of two
Q19: Higher total utility is represented by _
Q20: Higher indifference curves represent _ lower curves.
A)less
Q21: Which of the following is NOT TRUE
Q33: An indifference curve typically:
A)slopes downward.
B)shows combinations of
Q35: Max consumes only yogurt and almonds,and he
Q36: The slope of a(n)_ curve shows the
Q40: For most goods,indifference curves:
A)may intersect.
B)slope upward.
C)are concave
Q171: Indifference curves that exhibit a diminishing marginal
Q178: The marginal rate of substitution shows how
Unlock this Answer For Free Now!
View this answer and more for free by performing one of the following actions

Scan the QR code to install the App and get 2 free unlocks

Unlock quizzes for free by uploading documents