Which of the following graphs illustrates the behavior of a total variable cost?
A) Graph 2
B) Graph 3
C) Graph 4
D) Graph 1 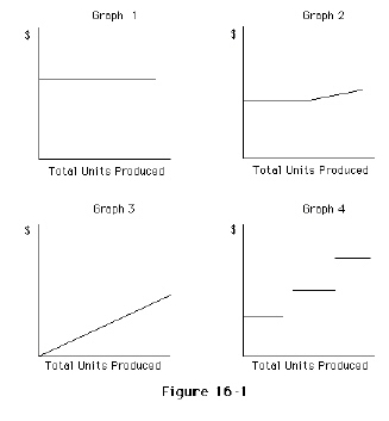
Correct Answer:
Verified
Q63: Which of the following describes the behavior
Q65: Given the following cost and activity
Q67: As production increases, fixed costs per unit
Q67: Knowing how costs behave to change in
Q68: As production increases,what should happen to the
Q70: Costs that vary in total in direct
Q73: Winston Co.manufactures office furniture.During the most productive
Q76: Which of the following costs is a
Q78: For the purpose of analysis, mixed costs
Q79: Which of the following statements is true
Unlock this Answer For Free Now!
View this answer and more for free by performing one of the following actions

Scan the QR code to install the App and get 2 free unlocks

Unlock quizzes for free by uploading documents