Which of the following graphs illustrates the nature of a mixed cost?
A) Graph 2
B) Graph 3
C) Graph 4
D) Graph 1 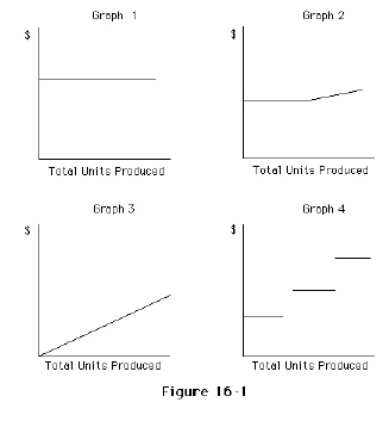
Correct Answer:
Verified
Q62: Which of the following is an example
Q64: The graph of a variable cost per
Q67: Knowing how costs behave to change in
Q68: As production increases,what should happen to the
Q73: Which of the following activity bases would
Q77: The systematic examination of the relationships among
Q77: Given the following costs and activity
Q79: Which of the following statements is true
Q80: Which of the following is an example
Q81: A firm operated at 90% of capacity
Unlock this Answer For Free Now!
View this answer and more for free by performing one of the following actions

Scan the QR code to install the App and get 2 free unlocks

Unlock quizzes for free by uploading documents