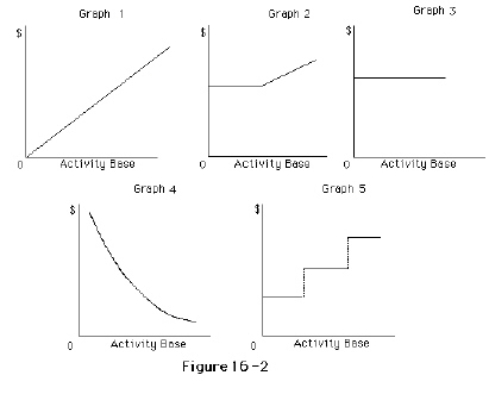
The following cost graphs illustrate various types of cost behaviors.
For each of the following costs, identify the cost graph that best describes its cost behavior as the number of units produced and sold increases.

Correct Answer:
Verified
Q110: The relative distribution of sales among the
Q121: For the past year,LaPrade Company had fixed
Q130: If a business had sales of $4,000,000,fixed
Q134: If sales amounted to $300,000, variable costs
Q137: For the past year,Cline Company had fixed
Q138: The following is a list of various
Q139: If a business had sales of $4,000,000
Q141: The difference between the current sales revenue
Q143: When a business sells more than one
Q145: Cost-volume-profit analysis cannot be used if which
Unlock this Answer For Free Now!
View this answer and more for free by performing one of the following actions

Scan the QR code to install the App and get 2 free unlocks

Unlock quizzes for free by uploading documents