Multiple Choice
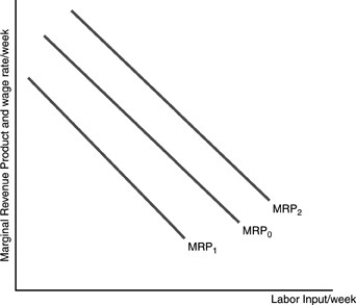
-Refer to the above figure. represents
A) the supply curve for the product.
B) the supply curve for labor.
C) the demand curve for the product.
D) the demand curve for labor.
Correct Answer:
Verified
Related Questions
Q101: An increase in the marginal factor cost
Q102: An increase in product price implies that
A)
Q104: The demand curve for labor will shift
Q105: Which of the following will not cause
Q105: A firm's demand curve for labor is
Q107: The downward sloping marginal revenue product of
Unlock this Answer For Free Now!
View this answer and more for free by performing one of the following actions

Scan the QR code to install the App and get 2 free unlocks

Unlock quizzes for free by uploading documents