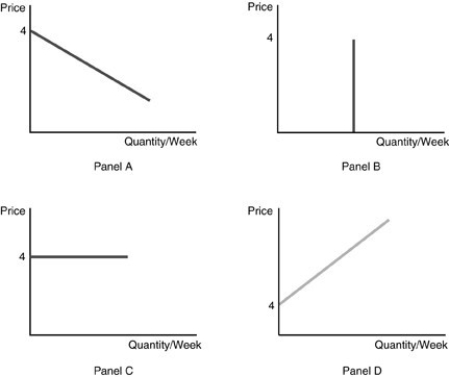
-Refer to the above figure. The market supply and demand curves in a perfectly competitive market intersect at $4. Which of the graphs represent the situation for an individual firm?
A) Panel A
B) Panel B
C) Panel C
D) Panel D
Correct Answer:
Verified
Q48: Under the perfectly competitive market structure, the
Q49: If a firm is a perfect competitor,
Q50: The perfectly competitive firm faces
A) a downward
Q51: The demand curve for a perfectly competitive
Q52: The demand curve for a perfectly competitive
Q54: Which of the following statements is correct?
A)
Q55: A perfectly competitive producer faces a demand
Q56: A perfectly elastic demand function
A) shows that
Q57: For a firm in a perfectly competitive
Q58: The demand curve for a perfectly competitive
Unlock this Answer For Free Now!
View this answer and more for free by performing one of the following actions

Scan the QR code to install the App and get 2 free unlocks

Unlock quizzes for free by uploading documents