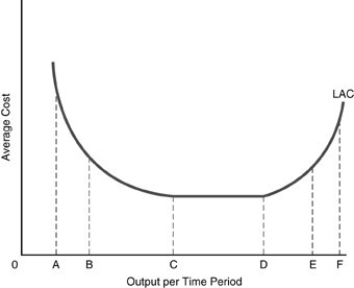
-In the above figure, the long-run cost curve between points A and B illustrates
A) diseconomies of scale.
B) diminishing marginal product.
C) constant returns to scale.
D) economies of scale.
Correct Answer:
Verified
Q317: When average variable costs are rising
A) marginal
Q318: What is the difference between average variable
Q319: What is the relationship between the marginal
Q320: If the marginal product curve is intersecting
Q321: Every point on the long-run average cost
Q323: Q324: If a firm gets so large that Q325: The long run is defined as a Q326: The long run for a business is Q327: ![]()
![]()
Unlock this Answer For Free Now!
View this answer and more for free by performing one of the following actions

Scan the QR code to install the App and get 2 free unlocks

Unlock quizzes for free by uploading documents