Multiple Choice
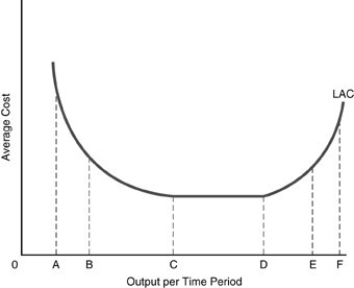
-In the above figure, the long-run cost curve between points C and D illustrates
A) diseconomies of scale.
B) diminishing marginal product.
C) constant returns to scale.
D) economies of scale.
Correct Answer:
Verified
Related Questions
Q322: Q323: Q324: If a firm gets so large that Q325: The long run is defined as a Q326: The long run for a business is Unlock this Answer For Free Now! View this answer and more for free by performing one of the following actions Scan the QR code to install the App and get 2 free unlocks Unlock quizzes for free by uploading documents![]()
![]()

