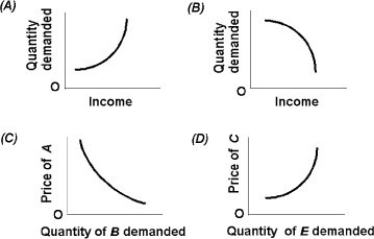
Multiple Choice

-Use the above figure. Which graph depicts substitute goods?
A) A
B) B
C) C
D) D
Correct Answer:
Verified
Related Questions
Q311: If the price of apples went down
Q312: The price of A falls by 2
Q313: Q314: The cross-price elasticity of demand of products Q315: If the cross price elasticity of demand Q317: Two items which have a positive cross Q318: If the price of one good increases, Q319: Suppose the price of A increases by Q320: The cross price elasticity of demand is Q321: Jill earns an income of $2,000 a![]()
Unlock this Answer For Free Now!
View this answer and more for free by performing one of the following actions

Scan the QR code to install the App and get 2 free unlocks

Unlock quizzes for free by uploading documents