Multiple Choice
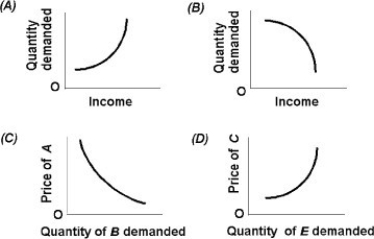
-Use the above figure. Which graph depicts an inferior good?
A) A
B) B
C) C
D) D
Correct Answer:
Verified
Related Questions
Q348: How does the cross elasticity of demand
Q349: "Income elasticity of demand is always positive."
Q350: If your income rises and, as a
Q351: If the supply of a good is
Q352: If the price elasticity of supply of
Unlock this Answer For Free Now!
View this answer and more for free by performing one of the following actions

Scan the QR code to install the App and get 2 free unlocks

Unlock quizzes for free by uploading documents