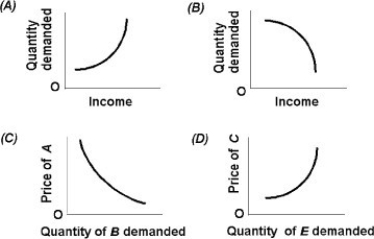
-Use the above figure. Which graph depicts a normal good?
A) A
B) B
C) C
D) D
Correct Answer:
Verified
Q338: The income elasticity of demand is
A) the
Q339: The difference between price elasticity of demand
Q340: Income elasticity of demand reflects
A) the change
Q341: Charlie's income went from $1000 per week
Q342: Use the above table. Based on the
Q344: What would you expect the cross price
Q345: If your income rises by one percent
Q346: Why can cross price elasticity of demand
Q347: Graphically, what is the main difference between
Q348: How does the cross elasticity of demand
Unlock this Answer For Free Now!
View this answer and more for free by performing one of the following actions

Scan the QR code to install the App and get 2 free unlocks

Unlock quizzes for free by uploading documents