Refer to the graphs below. 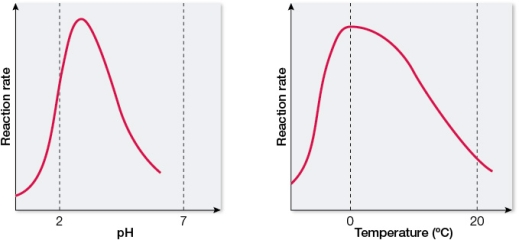 The graphs show data collected during the characterization of an enzyme.Which is the most likely source of the enzyme?
A) The heart of a desert mouse
B) The stomach of an Arctic fish
C) The brain of a tropical shark
D) The intestines of an African zebra
E) The muscles of a Texas hummingbird
Correct Answer:
Verified
Q208: Ascorbic acid, which is found in citrus
Q209: Refer to the table below.
Q210: Refer to the figures below showing changes
Q211: The binding of an effector molecule at
Q212: Which statement regarding allosterically regulated enzymes is
Q214: Refer to the graph below. 
Q215: The graph of enzyme activity versus substrate
Q216: An effector molecule that binds to a
Q217: An inhibitor that binds through covalent bonds
Q218: Some kinases can affect the activity of
Unlock this Answer For Free Now!
View this answer and more for free by performing one of the following actions

Scan the QR code to install the App and get 2 free unlocks

Unlock quizzes for free by uploading documents