Refer to the graph below. 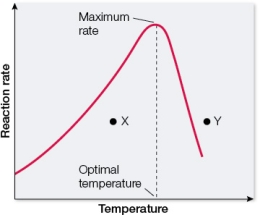 This graph shows the change in the rate of a reaction catalyzed by an enzyme as temperature is increased.At point _______, the low activity is due to denaturation of the enzyme, whereas at point _______, the low activity is due to low kinetic energies of the substrate and enzyme molecules in solution.
Correct Answer:
Verified
Q231: Refer to the graph below. 
Q232: Refer to the figure below.
Q233: To be metabolized, glucose must be
Q234: Which parameter is indicative of how
Q235: The binding of a substrate to an
Q237: The synthesis of complex molecules is _,
Q238: Refer to the graph below.
Q239: Which statement about ATP is false?
A) The
Q240: Which statement disagrees with the second law
Q241: Consider two enzyme reaction solutions.Solution 1 has
Unlock this Answer For Free Now!
View this answer and more for free by performing one of the following actions

Scan the QR code to install the App and get 2 free unlocks

Unlock quizzes for free by uploading documents