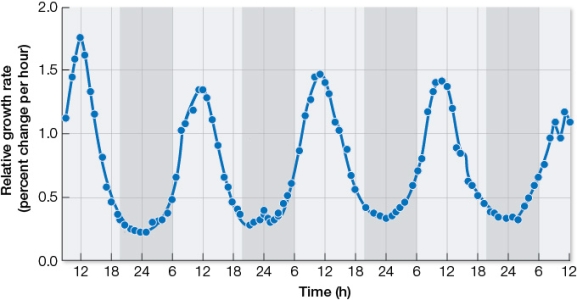
At hourly intervals, researchers measured the change in growth rate of a cactus, a CAM plant, over a 5-day period.The results were used to prepare the graph below.The shaded areas denote dark periods, while white areas denote daylight periods.  Which statement reasonably explains the pattern in the growth rate revealed in this graph? Remember to apply what you know about CAM plants and cells in general as you consider the various statement options.
A) CAM plant growth occurs when the plant is actively taking up carbon in the form of carbon dioxide from the atmosphere.
B) CAM plant growth occurs at times when the plant is not busy engaged in photosynthetic processes.
C) CAM plant growth occurs when Calvin cycle enzymes are actively producing G3P, since this compound can be immediately shuttled into anabolic pathways that support cell proliferation.
D) CAM plant growth occurs in cycles, since each round of cell division can only occur once every 24 hours because of a long period of DNA replication.
E) CAM plant growth occurs in cycles because light stimulates cell division and dark inhibits cell division.
Correct Answer:
Verified
Q95: Refer to the table below, created by
Q96: In CAM plants, during the day
A) CO2
Q97: Refer to the flowchart below. 
Q98: The light-driven production of ATP from ADP
Q99: The net chemical changes that result
Q101: Refer to the table below. 
Q102: In the 1600s, a Belgian physician named
Q103: What is the general equation of oxygenic
Q104: The reaction catalyzed by rubisco fixes one
Q105: Refer to the figure below. 
Unlock this Answer For Free Now!
View this answer and more for free by performing one of the following actions

Scan the QR code to install the App and get 2 free unlocks

Unlock quizzes for free by uploading documents