Refer to the graph below. 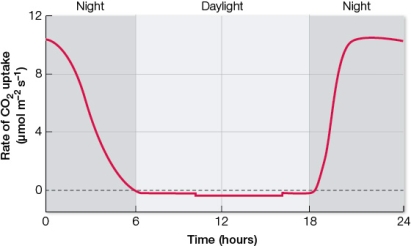 This graph was generated using data collected over a 24-hour period on the rate of carbon dioxide uptake by a leaf on a living plant.Based on the pattern revealed by the data, it can be concluded that the plant can be classified as a _______ plant.
Correct Answer:
Verified
Q232: C4 plants differ from C3 plants because
Q233: The immediate source of energy for ATP
Q234: Refer to the table below. 
Q235: In addition to driving the synthesis of
Q236: In the 1930s, researchers worked with green
Q237: Refer to the table below showing observations
Q238: In oxygenic photosynthesis, water is
A) oxidized to
Q240: Refer to the table below summarizing how
Q241: Mustard plants were grown under 16 hours
Q242: The chemical energy stored from photosynthesis represents
Unlock this Answer For Free Now!
View this answer and more for free by performing one of the following actions

Scan the QR code to install the App and get 2 free unlocks

Unlock quizzes for free by uploading documents