The graph shows the range of variation among population members for a trait determined by multiple genes. 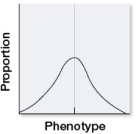 If this population were subject to stabilizing selection for several generations, which, if any, of the distributions shown would be most likely to result?
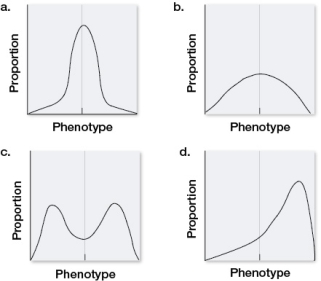
A) a
B) b
C) c
D) d
E) None of the above; there would be no change.
Correct Answer:
Verified
Q75: The numbers of fledged young of female
Q76: The numbers of fledged young of female
Q77: A species of yeast can reproduce either
Q78: Which mode(s) of selection result(s) in a
Q79: If the exchange of allele b1 for
Q81: In many bird species, the number of
Q82: Suppose the population size of a species
Q83: Which statement about the neurotoxin tetrodotoxin (TTX)
Q84: Which would not be considered an example
Q85: In scientific terms, the word "_" refers
Unlock this Answer For Free Now!
View this answer and more for free by performing one of the following actions

Scan the QR code to install the App and get 2 free unlocks

Unlock quizzes for free by uploading documents