Refer to the graph showing beak size for a population of a species of Darwin's finches. 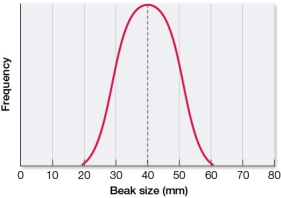 Draw a graph showing what the resulting population would most likely look like after a generation of stronger stabilizing selection.
Correct Answer:
Verified
Q104: If a change in the nucleotide, from
Q105: Yeast cells are sequenced periodically to examine
Q106: Asexual sawflies that migrate to North America
Q107: A population of swallowtail butterflies has an
Q108: A population of crickets has 84 individuals
Q110: An allele that increases the ability to
Q111: A population of monkeyflowers has 39 individuals
Q112: Yeast cells are sequenced periodically to examine
Q113: In a small, asexual population of rotifers,
Q114: Suppose variants at a single locus affect
Unlock this Answer For Free Now!
View this answer and more for free by performing one of the following actions

Scan the QR code to install the App and get 2 free unlocks

Unlock quizzes for free by uploading documents