Refer to the graph showing beak size for a population of a species of Darwin's finches. 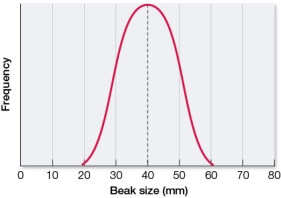 Draw a graph showing what the resulting population would most likely look like after a generation of strong disruptive selection.
Correct Answer:
Verified
Q131: A population of salmon is becoming increasingly
Q132: Draw the relationship between frequency of an
Q133: According to its scientific definition, a theory
Q134: Which of the following is not an
Q135: Suppose the mutation rate per nucleotide for
Q137: The numbers of fledged young of female
Q138: Refer to the graph showing beak size
Q139: In which way are mutation and gene
Q140: The survivorship of individuals from four different
Q141: Which statement about evolution is false?
A) Populations
Unlock this Answer For Free Now!
View this answer and more for free by performing one of the following actions

Scan the QR code to install the App and get 2 free unlocks

Unlock quizzes for free by uploading documents