Refer to the graph.In this experiment, the same fish were caught and brought into the lab in both winter and summer.Their metabolic rates (O2 consumption) were measured at the pond temperatures for each season (★) and at other temperatures ( ) . 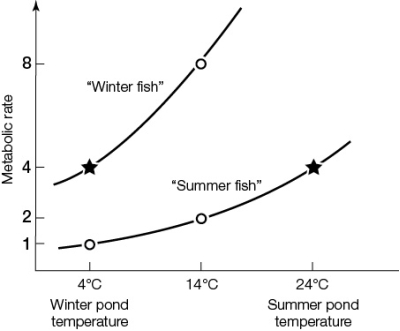 This experiment demonstrates the phenomenon of
A) homeostasis.
B) acclimatization.
C) declimatization.
D) negative feedback.
E) positive feedback.
Correct Answer:
Verified
Q175: The rate of a chemical reaction at
Q176: You monitor a lizard's body temperature in
Q177: When an ectotherm and an endotherm of
Q178: Which statement about endotherms is true?
A) They
Q179: Refer to the graph.In this experiment,
Q181: Mammals and birds have scroll-like bones, called
Q182: "Hot" fishes
A) lose less heat to the
Q183: A moth prior to taking flight can
Q184: Which statement is true?
A) When body temperature
Q185: The thermoneutral zone of an endotherm is
Unlock this Answer For Free Now!
View this answer and more for free by performing one of the following actions

Scan the QR code to install the App and get 2 free unlocks

Unlock quizzes for free by uploading documents