Refer to the graph showing body temperature and heart rate in the Galápagos marine iguana as it moves from feeding in the ocean to basking on hot rocks on shore. 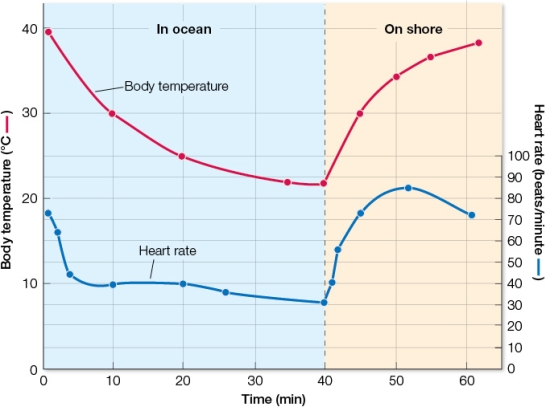 From this graph, a logical conclusion about the iguana is that
A) its heart rate is not regulated entirely by body temperature.
B) the maximum body temperature it achieves when on shore is 38°C.
C) its heart rate drops quickly in the cold ocean and rises more slowly on warm land.
D) the lowest heart rate the animal tolerates before coming back on land is approximately 7-8 beats per minute.
E) at comparable body temperatures, its heart rate is higher during cooling than warming.
Correct Answer:
Verified
Q186: Which factor influences all four avenues of
Q187: Through which avenue of heat exchange can
Q188: Which statement is true?
A) At low temperatures
Q189: A "hot" fish differs from a "cold"
Q190: Which statement is correct?
A) The thermoneutral zone
Q192: Which characteristic is true of a "cold"
Q193: The mechanism of heat transfer that occurs
Q194: You feel cooler when standing directly in
Q195: Heat is transferred from an animal's core
Q196: Which correctly represents an energy budget?
A) Metabolism
Unlock this Answer For Free Now!
View this answer and more for free by performing one of the following actions

Scan the QR code to install the App and get 2 free unlocks

Unlock quizzes for free by uploading documents