Refer to the graph. 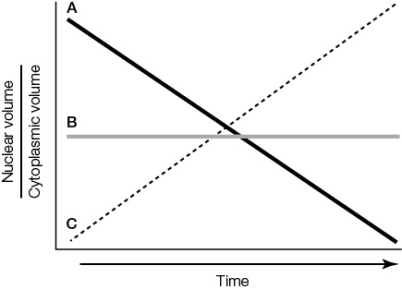 In the graph, curve _______ best represents the changes in the ratio of nuclear volume to cytoplasmic volume during early cleavage in most animals.At this time, the blastomeres _______ in size.
A) A; decrease
B) B; decrease
C) C; decrease
D) A; increase
E) C; increase
Correct Answer:
Verified
Q10: Suppose you are designing an embryology lab
Q11: Which feature is characteristic of development in
Q12: If you were interested in studying spiral
Q13: In a placental mammal, destruction of cells
Q14: A researcher who wants to block initiation
Q16: Which are least likely to be cytoplasmic
Q17: Refer to the figure showing implantation in
Q18: The sperm contributes _ to the zygote.
A)
Q19: Which statement about cleavage and early development
Q20: The gray crescent in a frog zygote
A)
Unlock this Answer For Free Now!
View this answer and more for free by performing one of the following actions

Scan the QR code to install the App and get 2 free unlocks

Unlock quizzes for free by uploading documents