Refer to the graph showing the tracing of membrane potential change during the course of an action potential. 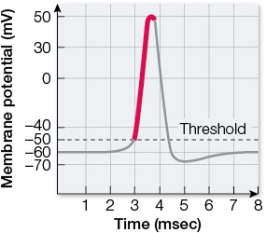 Which event is occurring in the section of the tracing highlighted in red?
A) Closing of sodium channel inactivation gates
B) Opening of voltage-gated sodium channel activation gates
C) Closing of potassium leak channels
D) Opening of gated potassium channels
E) Closing of all gated channels
Correct Answer:
Verified
Q169: Refer to the graph showing the tracing
Q170: Which statement about neuronal membranes is false?
A)
Q171: If you wanted to cause a voltage-gated
Q172: During an action potential, activation gates in
Q173: The Goldman equation can be used to
Q175: When K+ ions diffuse out of a
Q176: The opening and closing of single ion
Q177: The direction and amount of movement of
Q178: When you recorded the membrane potential of
Q179: When gated channels open or close the
Unlock this Answer For Free Now!
View this answer and more for free by performing one of the following actions

Scan the QR code to install the App and get 2 free unlocks

Unlock quizzes for free by uploading documents