Refer to the graph showing ventilation rates in a human. 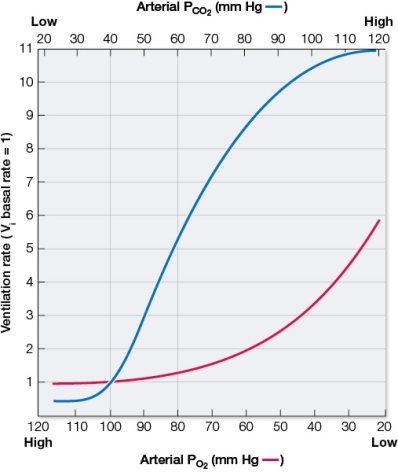 Based on the graph, it would take a drop in arterial PO2 from 100 mm Hg to about _______ mm Hg to bring about the same change in ventilation rate as an increase in arterial PCO2 from 40 mm Hg to 60 mm Hg.
Correct Answer:
Verified
Q233: The Everest Base Camp in Nepal is
Q234: In using a flowmeter to measure the
Q235: Refer to the graph showing ventilation rates
Q236: In the human gas exchange system,
A) the
Q237: In birds, the _ expand during inhalation,
Q239: Christopher Reeve, the actor best known for
Q240: Respiratory gases are exchanged between the body
Q241: If you climb a mountain to an
Q242: While a runner rests before a race,
Q243: In an experiment, you increase the levels
Unlock this Answer For Free Now!
View this answer and more for free by performing one of the following actions

Scan the QR code to install the App and get 2 free unlocks

Unlock quizzes for free by uploading documents