Refer to the graph, which shows blood pressure, blood velocity, and area of the blood vessels throughout a human circulatory system. 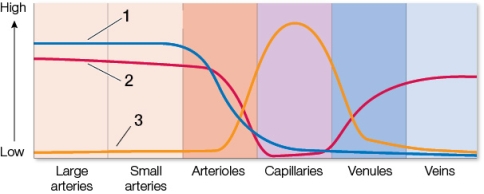 Which of the statement about the graph is false?
A) The vessels represented on the left of the graph have many extracellular collagen and elastin fibers in their walls.
B) The rise in curve 2 on the right side of the graph is caused by rhythmic contraction of smooth muscles surrounding the veins.
C) The vessels represented on the far right of the graph are referred to as capacitance vessels.
D) Fluid may be drawn back into the blood vessels represented on the right side of curve 3 by a high osmotic potential.
E) The vessels represented on the far right of the graph may hold 60 percent of a person's blood at any given time.
Correct Answer:
Verified
Q72: Blood is at its lowest pressure in
Q73: A patient suffers from excessive bleeding whenever
Q74: The carcass of a newly discovered deep-diving
Q75: Refer to the graph, which shows blood
Q76: Below the level of the heart, the
Q78: The Frank-Starling law suggests that during exercise,
Q79: Which statement about veins is false?
A) Veins
Q80: The circulating protein fibrinogen contributes to blood
Q81: Olympic wrestlers grapple with each other for
Q82: Turtles can largely bypass the lung circuit
Unlock this Answer For Free Now!
View this answer and more for free by performing one of the following actions

Scan the QR code to install the App and get 2 free unlocks

Unlock quizzes for free by uploading documents