Refer to the diagrams below. 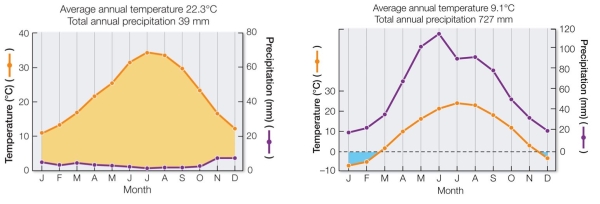 The Walter climate diagrams illustrate typical annual temperature and precipitation values for which two biomes?
A) Left: desert; right: boreal forest
B) Left: desert; right: temperate grassland
C) Left: tundra; right: boreal forest
D) Left: temperate deciduous forest; right: temperate grassland
E) Left: temperate grassland; right: temperate deciduous forest
Correct Answer:
Verified
Q56: The classification of biomes, such as the
Q57: A large river flows across a plain
Q58: Variations or discontinuities of the physical environment
Q59: The region of the oceans most likely
Q60: Studies show that when a forest is
Q62: As global warming progresses, plants and animals
Q63: Refer to the map below. 
Q64: Biogeographers classify biomes in terms of their
Q65: A new river cuts through the range
Q66: Refer to the map below.
Unlock this Answer For Free Now!
View this answer and more for free by performing one of the following actions

Scan the QR code to install the App and get 2 free unlocks

Unlock quizzes for free by uploading documents