Suppose the r value for the population growth curve on this graph equals 1.00.Describe how the curve would appear if the r value were 1.50 instead of 1.00.Explain why this would happen. 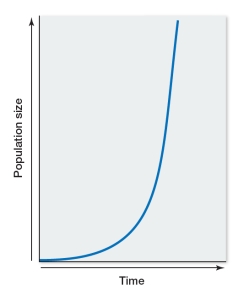
Correct Answer:
Verified
View Answer
Unlock this answer now
Get Access to more Verified Answers free of charge
Q133: Given that the amount of space on
Q134: Consider a population of bullfrogs in a
Q135: The average life span of the human
Q136: A metapopulation would be most likely to
Q137: Advanced fishing technology has made overharvesting of
Q139: On January 1, an animal population is
Q140: The table shows hypothetical colonization data for
Q141: The density of a population is defined
Q142: Members of a bird species defend a
Q143: Mountain sheep in Southern California are separated
Unlock this Answer For Free Now!
View this answer and more for free by performing one of the following actions

Scan the QR code to install the App and get 2 free unlocks

Unlock quizzes for free by uploading documents