Suppose the r value for the population represented by the curve decreases over time.What would happen to the curve? 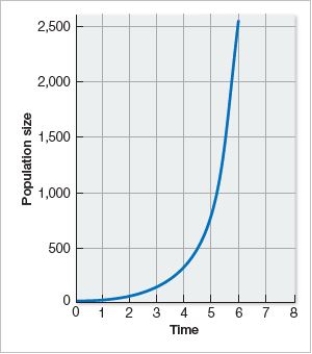
A) It would become more linear.
B) It would become more logistic.
C) It would not change significantly.
D) It would move to the left and remain exponential.
E) It would move to the right and remain exponential.
Correct Answer:
Verified
Q189: When Pacific salmon migrate to freshwater streams
Q190: Population X has 10,000 individuals; Population Y
Q191: Due to the difficulty of following their
Q192: North Pacific humpback whale populations declined dramatically
Q193: If a population displays density-dependent effects, it
Q195: A cohort life table allows population ecologists
Q196: A population can grow at its maximum
Q197: The fecundity of a population indicates
A) the
Q198: Density-independent regulatory factors include all of these
Q199: A graph of a population's logistic growth
Unlock this Answer For Free Now!
View this answer and more for free by performing one of the following actions

Scan the QR code to install the App and get 2 free unlocks

Unlock quizzes for free by uploading documents