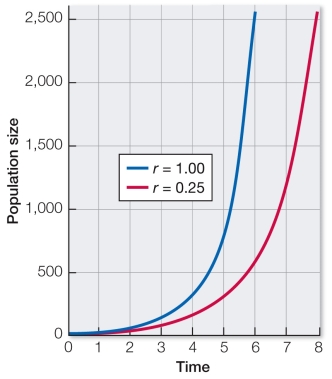
Which sentence best explains the difference in position between the curve for r = 1.00 and the curve for r = 0.25? 
A) The r = 1.00 curve adds a larger multiple of the population size at each time interval than does the r = 0.25 curve.
B) The r = 1.00 curve adds a smaller multiple of the population size at each time interval than does the r = 0.25 curve.
C) The r = 1.00 curve adds a multiple of the population size at each time interval and the r = 0.25 curve adds the same number each time.
D) The r = 1.00 curve adds the same number to the population size at each time interval; the r = 0.25 curve adds the same number, but a smaller number, each time.
E) The r = 1.00 curve adds the same number to the population size at each time interval; the r = 0.25 curve adds the same number, but a larger number, each time.
Correct Answer:
Verified
Q195: A cohort life table allows population ecologists
Q196: A population can grow at its maximum
Q197: The fecundity of a population indicates
A) the
Q198: Density-independent regulatory factors include all of these
Q199: A graph of a population's logistic growth
Q201: The life cycle of humans can best
Q202: Houseflies have a life cycle of about
Q203: Which population of organisms would be most
Q204: In studying a tiny nematode worm, scientists
Q205: A survivorship curve for an organism that
Unlock this Answer For Free Now!
View this answer and more for free by performing one of the following actions

Scan the QR code to install the App and get 2 free unlocks

Unlock quizzes for free by uploading documents