Refer to figure. 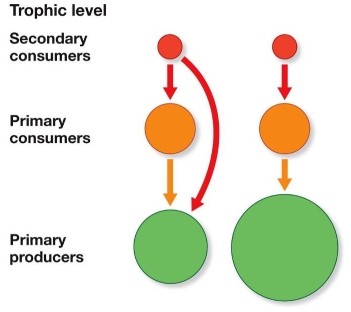 The diagram represents top-down control of two food webs with three trophic levels.The food web represented on the left includes omnivores, and the one on the right does not.Which effect of omnivores most directly results in the decreased size of the primary producer level shown on the left?
A) Competing with other omnivores
B) Competing with primary producers
C) Feeding on primary consumers
D) Feeding on primary producers
E) Preying on top carnivores
Correct Answer:
Verified
Q166: Refer to the figure. Q167: Refer to the graph, showing a continual Q168: Moving carbon, nitrogen, and other nutrients around Q169: As atmospheric CO2 levels rise, much of Q170: Compare the climates in two African ecosystems: Q172: In the diagram, boxes represent pools, and Q173: An ecosystem contains two food chains: Q174: A major distinction between decomposition and mineralization Q175: The major factor causing carbon dioxide increase Q176: The Ogallala Aquifer runs from South Dakota![]()
Unlock this Answer For Free Now!
View this answer and more for free by performing one of the following actions

Scan the QR code to install the App and get 2 free unlocks

Unlock quizzes for free by uploading documents