Refer to the graphs, showing global patterns of changes in NPP with changing temperatures and precipitation. 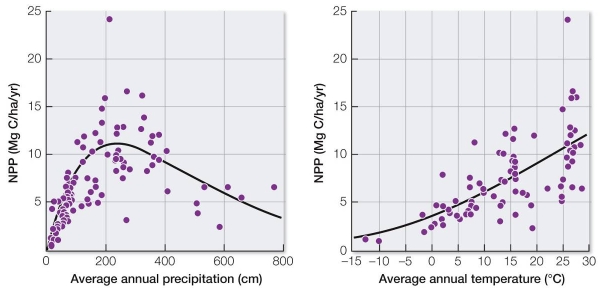 In the boreal forest, or taiga, average annual precipitation is between 20 and 200 cm, depending on location, and the average annual temperature varies between -5°C and +5°C.This suggests that the NPP of the boreal forest is _______ mg C/ha/yr.
A) less than 1
B) between 1 and 5
C) between 5 and 10
D) between 10 and 12
E) between 12 and 15
Correct Answer:
Verified
Q228: Food webs can be regulated by mostly
Q229: Pacific salmon swim up freshwater rivers to
Q230: A student calculates the amount of plant
Q231: In a major upwelling region in the
Q232: Refer to the graph, showing changes in
Q233: The average net primary production (NPP) per
Q234: In the process of biogeochemical cycling, what
Q235: The economic value of pollinator services for
Q236: An ecosystem has very high productivity, abundant
Q238: Before Hurricane Katrina devastated New Orleans in
Unlock this Answer For Free Now!
View this answer and more for free by performing one of the following actions

Scan the QR code to install the App and get 2 free unlocks

Unlock quizzes for free by uploading documents