Refer to the figure. 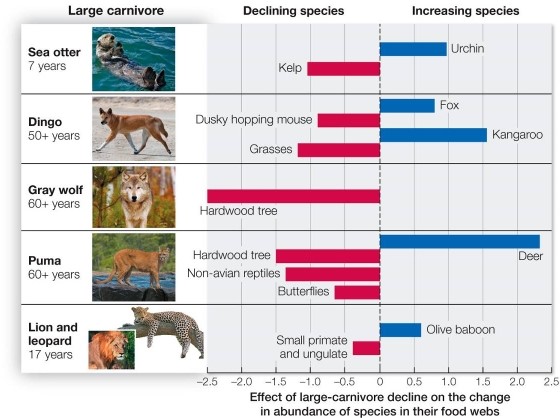 The diagram shows the effects of large carnivore declines on other species in their food webs.Blue bars represent direct effects of carnivore declines, and red bars represent indirect effects.The data suggest that species such as deer increased when the carnivore left, and then caused the secondary decline of other species, such as hardwood trees.This means that the large carnivore served as a(n)
A) heterotroph, with a minor role in the ecosystem.
B) ecosystem engineer, which physically modifies the environment.
C) top predator, which maintains a trophic cascade, affecting lower trophic levels.
D) foundation species, which builds habitat for other species.
E) autotroph, which provides food for the rest of the food web.
Correct Answer:
Verified
Q18: Scientists varied the effective population size of
Q19: Which statement is both correct and supports
Q20: Major causes of the global decrease in
Q21: Blue whales, the world's largest animal, occur
Q22: When the brown tree snake was introduced
Q24: One way to determine whether a population
Q25: Which is the least likely way in
Q26: An industry releases toxic chemicals into a
Q27: An invasive species might have any of
Q28: The flightless dodo bird lived on the
Unlock this Answer For Free Now!
View this answer and more for free by performing one of the following actions

Scan the QR code to install the App and get 2 free unlocks

Unlock quizzes for free by uploading documents