Figure 9-26
The diagram below illustrates the market for baseballs in the U.S. 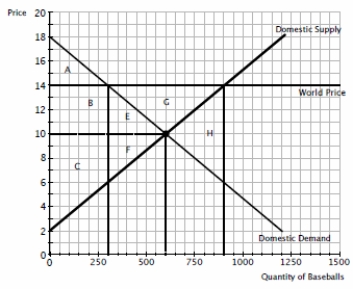
-Refer to figure 9-26.Prior to opening the U.S.baseball market to trade,the equilibrium price of a baseball is
A) $16
B) $12
C) $10
D) $8
Correct Answer:
Verified
Q286: Figure 9-24
The following diagram shows the domestic
Q287: Figure 9-25
The following diagram shows the domestic
Q288: Figure 9-26
The diagram below illustrates the market
Q289: Figure 9-25
The following diagram shows the domestic
Q290: Figure 9-24
The following diagram shows the domestic
Q292: Figure 9-24
The following diagram shows the domestic
Q293: Figure 9-24
The following diagram shows the domestic
Q294: Figure 9-24
The following diagram shows the domestic
Q295: Figure 9-23
The following diagram shows the domestic
Q296: When a country opens up to trade
Unlock this Answer For Free Now!
View this answer and more for free by performing one of the following actions

Scan the QR code to install the App and get 2 free unlocks

Unlock quizzes for free by uploading documents