Figure 6-33
The diagram shows the effect of a tax as measured by the distance between J and K. 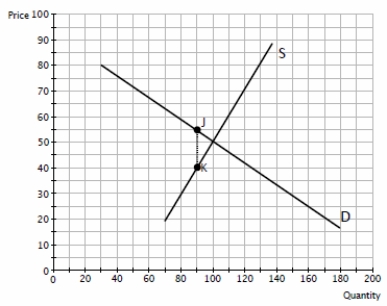
-Refer to Figure 6-33.Based upon the diagram,
A) the incidence of the tax falls more heavily on buyers.
B) the incidence of the tax falls more heavily on sellers.
C) the incidence of the tax is shared equally by both buyers and sellers.
D) the incidence of the tax cannot be determined based upon the information in the diagram.
Correct Answer:
Verified
Q177: The incidence of a tax falls more
Q178: The Federal Insurance Contribution Act (FICA)tax is
Q179: Suppose that a tax is placed on
Q180: Suppose that the demand for light bulbs
Q181: The demand for salt is inelastic,and the
Q183: Figure 6-29
Suppose the government imposes a $2
Q184: Assume the demand for cigarettes is relatively
Q185: Figure 6-29
Suppose the government imposes a $2
Q186: Figure 6-29
Suppose the government imposes a $2
Q187: Figure 6-30![]()
Unlock this Answer For Free Now!
View this answer and more for free by performing one of the following actions

Scan the QR code to install the App and get 2 free unlocks

Unlock quizzes for free by uploading documents