Figure 6-13
This figure shows the market demand and market supply curves for good X. 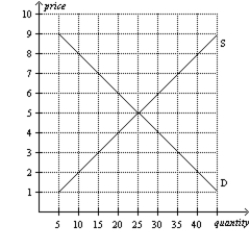
-Refer to Figure 6-13.If the government imposes a price ceiling of $4 on this market,then there will be
A) no shortage.
B) a shortage of 5 units.
C) a shortage of 10 units.
D) a shortage of 20 units.
Correct Answer:
Verified
Q122: Figure 6-15 Q123: Figure 6-14 Q124: Figure 6-13 Q125: Figure 6-10 Q126: Figure 6-12 Q128: Figure 6-14 Q129: Figure 6-10 Q130: Figure 6-12 Q131: Figure 6-13 Q132: Figure 6-11 Unlock this Answer For Free Now! View this answer and more for free by performing one of the following actions Scan the QR code to install the App and get 2 free unlocks Unlock quizzes for free by uploading documents![]()
![]()
This figure shows the market demand![]()
![]()
![]()
![]()
![]()
This figure shows the market demand![]()

