Figure 6-14 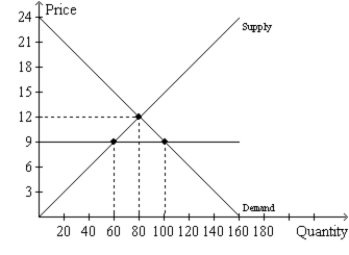
-Refer to Figure 6-14.If the horizontal line on the graph represents a price ceiling,then the price ceiling is
A) binding and creates a shortage of 20 units of the good.
B) binding and creates a shortage of 40 units of the good.
C) not binding but creates a shortage of 40 units of the good.
D) not binding,and there will be no surplus or shortage of the good.
Correct Answer:
Verified
Q118: Figure 6-6 Q119: Figure 6-7 Q120: Figure 6-7 Q121: Figure 6-13 Q122: Figure 6-15 Q124: Figure 6-13 Q125: Figure 6-10 Q126: Figure 6-12 Q127: Figure 6-13 Q128: Figure 6-14 Unlock this Answer For Free Now! View this answer and more for free by performing one of the following actions Scan the QR code to install the App and get 2 free unlocks Unlock quizzes for free by uploading documents![]()
![]()
![]()
This figure shows the market demand![]()
This figure shows the market demand![]()
![]()
This figure shows the market demand![]()

