Multiple Choice
Figure 4-1 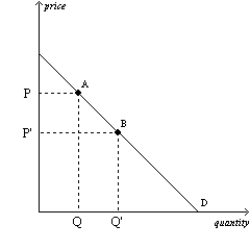
-Refer to Figure 4-1.The movement from point A to point B on the graph shows a(n)
A) decrease in demand.
B) increase in demand.
C) decrease in quantity demanded.
D) increase in quantity demanded.
Correct Answer:
Verified
Related Questions
Q1: Which of these statements best represents the
Q3: A downward-sloping demand curve illustrates
A)that demand decreases
Q4: A decrease in the price of a
Q5: A movement downward and to the right
Q6: "Other things equal,when the price of a
Q7: A decrease in the price of a
Q8: A movement upward and to the left
Unlock this Answer For Free Now!
View this answer and more for free by performing one of the following actions

Scan the QR code to install the App and get 2 free unlocks

Unlock quizzes for free by uploading documents