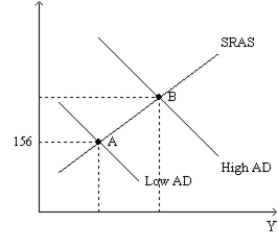
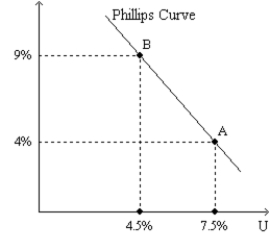
Figure 35-3.The left-hand graph shows a short-run aggregate-supply (SRAS) curve and two aggregate-demand (AD) curves.On the left-hand diagram,Y represents output and on the right-hand diagram,U represents the unemployment rate. 

-Refer to Figure 35-3.What is measured along the vertical axis of the left-hand graph?
A) the wage rate
B) the inflation rate
C) the price level
D) the change in output from one year to the next
Correct Answer:
Verified
Q41: Figure 35-4.The left-hand graph shows a short-run
Q42: Figure 35-1.The left-hand graph shows a short-run
Q44: Figure 35-2
Use the pair of diagrams below
Q45: Figure 35-1.The left-hand graph shows a short-run
Q47: Figure 35-3.The left-hand graph shows a short-run
Q48: Figure 35-3.The left-hand graph shows a short-run
Q50: Figure 35-2
Use the pair of diagrams below
Q51: Figure 35-1.The left-hand graph shows a short-run
Q122: The government of Blenova considers two policies.
Q138: Figure 35-1 ![]()
Unlock this Answer For Free Now!
View this answer and more for free by performing one of the following actions

Scan the QR code to install the App and get 2 free unlocks

Unlock quizzes for free by uploading documents