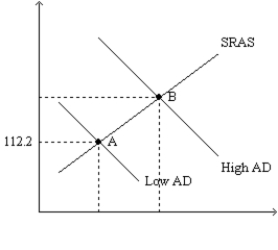
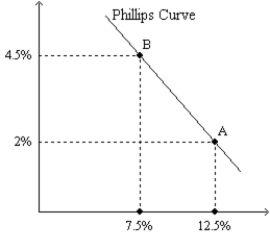
Figure 35-4.The left-hand graph shows a short-run aggregate-supply (SRAS) curve and two aggregate-demand (AD) curves.On the left-hand diagram,the price level is measured on the vertical axis;on the right-hand diagram,the inflation rate is measured on the vertical axis. 

-Refer to Figure 35-4.Assume the figure charts possible outcomes for the year 2018.In 2018,the economy is at point B on the left-hand graph,which corresponds to point B on the right-hand graph.Also,point A on the left-hand graph corresponds to A on the right-hand graph.The price level in the year 2018 is
A) 117.25.
B) 114.95.
C) 113.12.
D) 111.10.
Correct Answer:
Verified
Q73: As the aggregate demand curve shifts leftward
Q74: If the central bank decreases the money
Q75: If consumer confidence rises,then aggregate demand shifts
A)right,making
Q76: During the financial crisis Congress and President
Q77: In 2007 and 2008 households and firms
Q79: According to the short-run Phillips curve,inflation
A)and unemployment
Q81: If consumer confidence falls,then aggregate demand shifts
A)right,raising
Q82: Which of the following increases inflation and
Q133: In 2009, Congress and President Obama approved
Q153: Suppose Congress decides to reduce government expenditures
Unlock this Answer For Free Now!
View this answer and more for free by performing one of the following actions

Scan the QR code to install the App and get 2 free unlocks

Unlock quizzes for free by uploading documents