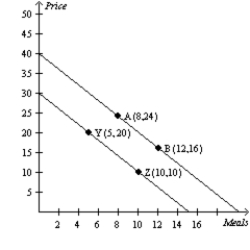
Figure 2-18
Relationship between Price and Restaurant Meals 
-Refer to Figure 2-18.The slope of the line containing points A and B is
A) -1/2.
B) -2.
C) 1/2.
D) 2.
Correct Answer:
Verified
Q40: Figure 2-16 Q41: Figure 2-18 Q42: Which of the following is correct? Q43: Figure 2-18 Q44: A relatively steep demand curve indicates that Q46: When income increases the slope of an Q47: The slope of a fairly flat upward-sloping Q48: The slope of a line is equal Q49: A relatively flat demand curve indicates that Q50: Which of the following is not correct?![]()
Relationship between Price and Restaurant Meals
A)A horizontal
Relationship between Price and Restaurant Meals
A)quantity
A)quantity
A)The
Unlock this Answer For Free Now!
View this answer and more for free by performing one of the following actions

Scan the QR code to install the App and get 2 free unlocks

Unlock quizzes for free by uploading documents