A education researcher measured the IQ test scores of 78 seventh-grade students in a rural school, and also their school grade point average (GPA) measured on a 12-point scale. Here is a graph of GPA versus IQ for these students: 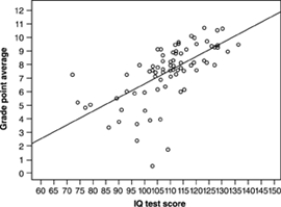 The line drawn on the graph is the least-squares regression line of GPA on IQ. Use this line to predict the GPA of a student with IQ 110. Your prediction is GPA about
A) 1.7.
B) 6)
C) 7.5.
D) 9.
Correct Answer:
Verified
Q27: A year-long fitness center study sought to
Q28: Lean body mass (your weight leaving out
Q29: A study of many countries finds a
Q30: A year-long fitness center study sought to
Q31: The best way to settle questions of
Q32: A study of the effects of television
Q33: If the least-squares regression line for predicting
Q35: A year-long fitness center study sought to
Q36: Deaths from highway accidents went down after
Q37: A study found correlation r = 0.43
Unlock this Answer For Free Now!
View this answer and more for free by performing one of the following actions

Scan the QR code to install the App and get 2 free unlocks

Unlock quizzes for free by uploading documents