How well does the number of beers a student drinks predict his or her blood alcohol content? Sixteen student volunteers at The Ohio State University drank a randomly assigned number of cans of beer. Thirty minutes later, a police officer measured their blood alcohol content (BAC) . A scatterplot of the data appears below. 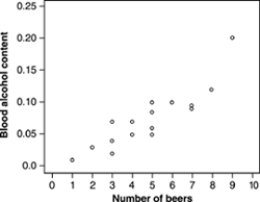 The scatterplot above shows
A) a moderately strong negative straight-line relationship between number of beers and BAC.
B) a weak negative straight-line relationship between number of beers and BAC.
C) almost no relationship between number of beers and BAC.
D) a weak positive straight-line relationship between number of beers and BAC.
E) a moderately strong positive straight-line relationship between number of beers and BAC.
Correct Answer:
Verified
Q3: How well does the number of beers
Q4: Which statistical measure is not strongly affected
Q5: You calculate the correlation between height and
Q6: A correlation cannot have the value
A) 0.4.
B)
Q7: To display the relationship between per capita
Q9: A random sample of patients who attended
Q10: In a scatterplot we can see
A) a
Q11: Which of these is not true of
Q12: The correlation between the foot lengths of
Q13: A nutrition study measuring how many helpings
Unlock this Answer For Free Now!
View this answer and more for free by performing one of the following actions

Scan the QR code to install the App and get 2 free unlocks

Unlock quizzes for free by uploading documents