An education researcher measured the IQ test scores of 78 seventh-grade students in a rural school, and also their school grade point average (GPA) measured on a 12-point scale. Here is a graph of GPA versus IQ for these students: 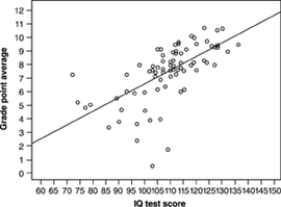 The name for this kind of graph is a
A) histogram.
B) bivariate plot.
C) boxplot.
D) scatterplot.
Correct Answer:
Verified
Q22: A study of home heating costs collects
Q23: The correlation between average monthly temperature x
Q24: The numerical value of a correlation coefficient
Q25: All 753 students in grades 1 through
Q26: An agricultural economist says that the correlation
Q28: A psychologist says that the correlation between
Q29: A study of home heating costs collects
Q30: Consider the following data: Q31: Here are the heights of a young Q32: Which of the statements does not contain![]()
Unlock this Answer For Free Now!
View this answer and more for free by performing one of the following actions

Scan the QR code to install the App and get 2 free unlocks

Unlock quizzes for free by uploading documents