Here is a table of the undergraduate enrollment at a large state university, broken down by class: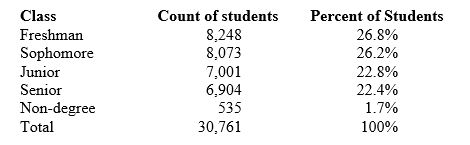
To make a correct graph of the distribution of students by class, you could use a
A) bar graph.
B) pie chart.
C) line graph.
D) Answers bar graph, pie chart, and line graph are correct.
E) Both bar graph and pie chart are correct.
Correct Answer:
Verified
Q13: Here is a table of the undergraduate
Q14: Is the level of belief in anthropogenic
Q15: A line graph shows that the price
Q16: To illustrate a talk you are giving,
Q17: Is the type of high school a
Q19: While an analyst considers the time plot
Q20: The age, weight, imbiber status (drinker or
Q21: To display the percent of residents at
Q22: In a young woman's study group, 7
Q23: The proper graph for showing the percentage
Unlock this Answer For Free Now!
View this answer and more for free by performing one of the following actions

Scan the QR code to install the App and get 2 free unlocks

Unlock quizzes for free by uploading documents